Overview
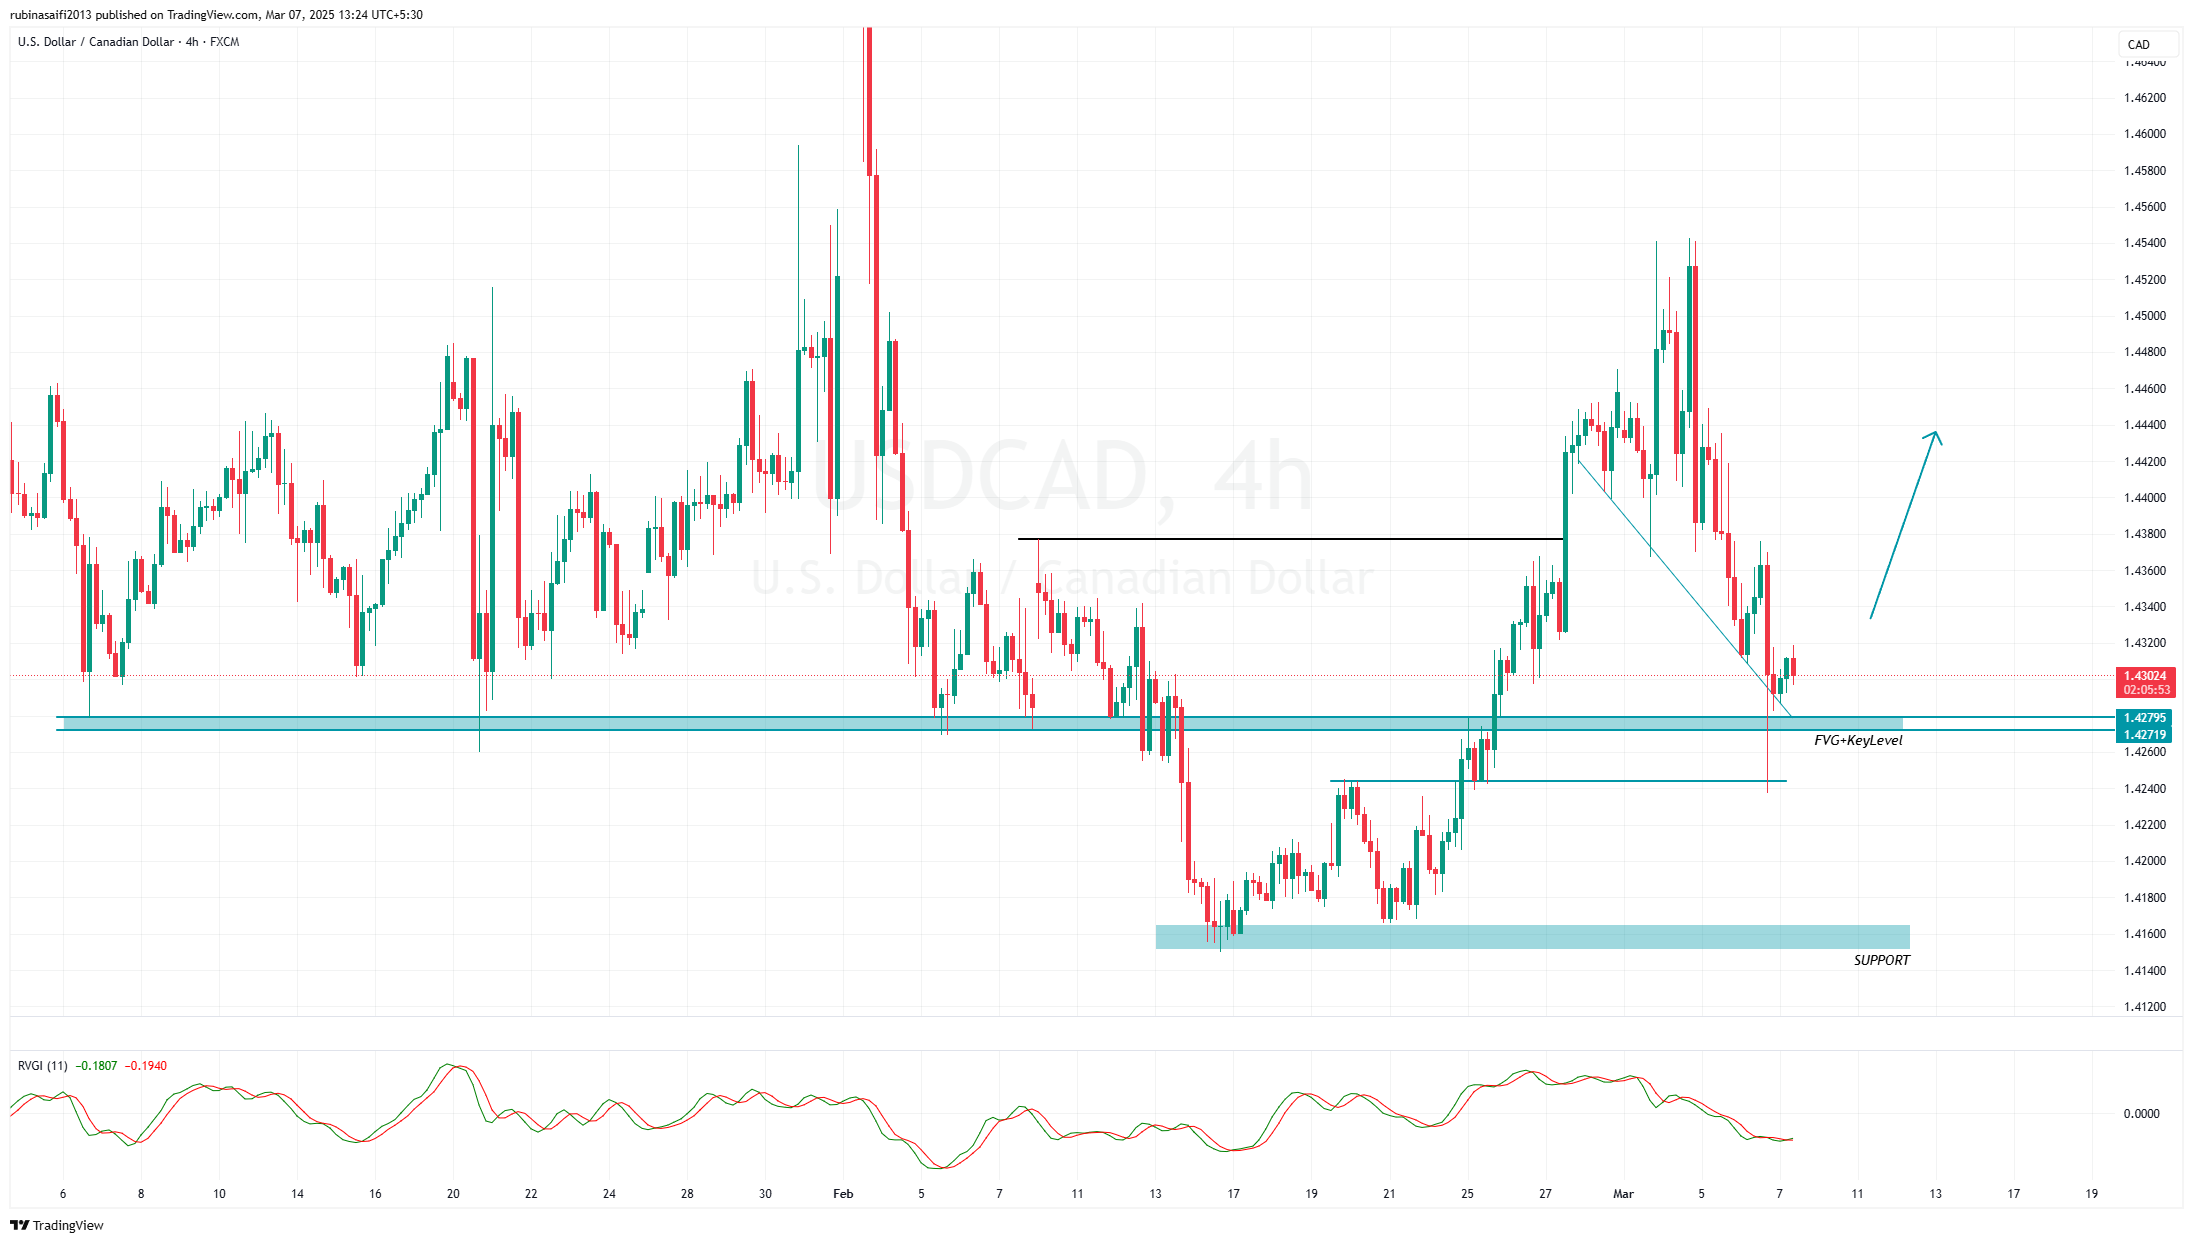
The USDCAD currency pair has reached a significant Fair Value Gap (FVG) and key support level around 1.4270 – 1.4290, which presents a crucial decision point for price action. After a strong bullish rally, the pair has pulled back to a demand zone, showing signs of potential reversal.
In this analysis, we will break down the key technical levels, market structure, momentum indicators, and trade setup to identify possible price movements.
Technical Analysis
1. Key Support & Resistance Levels
- Support Zone: 1.4260 – 1.4290 (FVG Key Level)
- Major Support Level: 1.4100 (previous demand zone)
- Resistance Levels:
- First Resistance (TP1): 1.4380
- Second Resistance (TP2): 1.4440
- Major Resistance: 1.4500+ (psychological level)
2. Market Structure & Price Action
- Higher Timeframe Trend: Bullish structure on the daily timeframe, with a temporary pullback on the 4H timeframe.
- Recent Price Action: The market has tested the FVG and key level at 1.4270 – 1.4290 and is showing rejection signs, which suggests a potential bounce.
- Breakout Confirmation: If price breaks above 1.4320, it would confirm bullish momentum toward 1.4380 – 1.4440.
3. Moving Averages (EMA Analysis)
- 50 EMA (short-term trend): Positioned near 1.4320, acting as dynamic resistance.
- 100 EMA (medium-term trend): Located near 1.4380, aligning with the first TP.
- 200 EMA (long-term trend): Positioned higher, indicating the major uptrend remains intact.
4. Momentum Indicator (RVGI – Relative Vigor Index)
- Current Position: RVGI indicator is in the oversold region, showing early signs of bullish divergence.
- Implication: If RVGI crosses upward, it will confirm bullish momentum for the next upside move.
Trade Setup & Entry Plan
🔹 Long Position Setup (Buying Trade)
- Entry Zone: 1.4270 – 1.4290 (FVG & Key Support Zone)
- Stop Loss (SL): Below 1.4200 (Strong support break invalidates the setup)
- Take Profit (TP1): 1.4380 (first resistance level)
- Take Profit (TP2): 1.4440 (second resistance level, aligning with structure high)
- Risk-Reward Ratio: 1:3 (Good for swing trading opportunities)
Entry Confirmation
- Look for bullish candlestick formations, such as a bullish engulfing pattern or pin bar rejection, around 1.4270 – 1.4290.
- A break above 1.4320 confirms momentum toward 1.4380 – 1.4440.
Alternative Bearish Scenario
If price fails to hold above 1.4260, it may break lower toward:
- 1.4200 (minor support level)
- 1.4100 (major support level & demand zone)
A confirmed break below 1.4200 would invalidate the long setup, and traders should wait for further price action confirmation before entering new trades.
Conclusion
The USDCAD market structure remains bullish, with the 1.4270 – 1.4290 zone acting as a key decision level. A strong rejection from this area would confirm a potential bullish move toward 1.4380 – 1.4440. However, if price breaks below 1.4200, further downside toward 1.4100 could be expected.
📌 Key Trading Notes:
✅ Bullish above 1.4270 – 1.4290 (FVG Key Level)
❌ Bearish below 1.4200 (Invalidates long setup)
🎯 Target levels: 1.4380 → 1.4440
Traders should wait for confirmation signals before entering and manage risk carefully. 🚀