Introduction
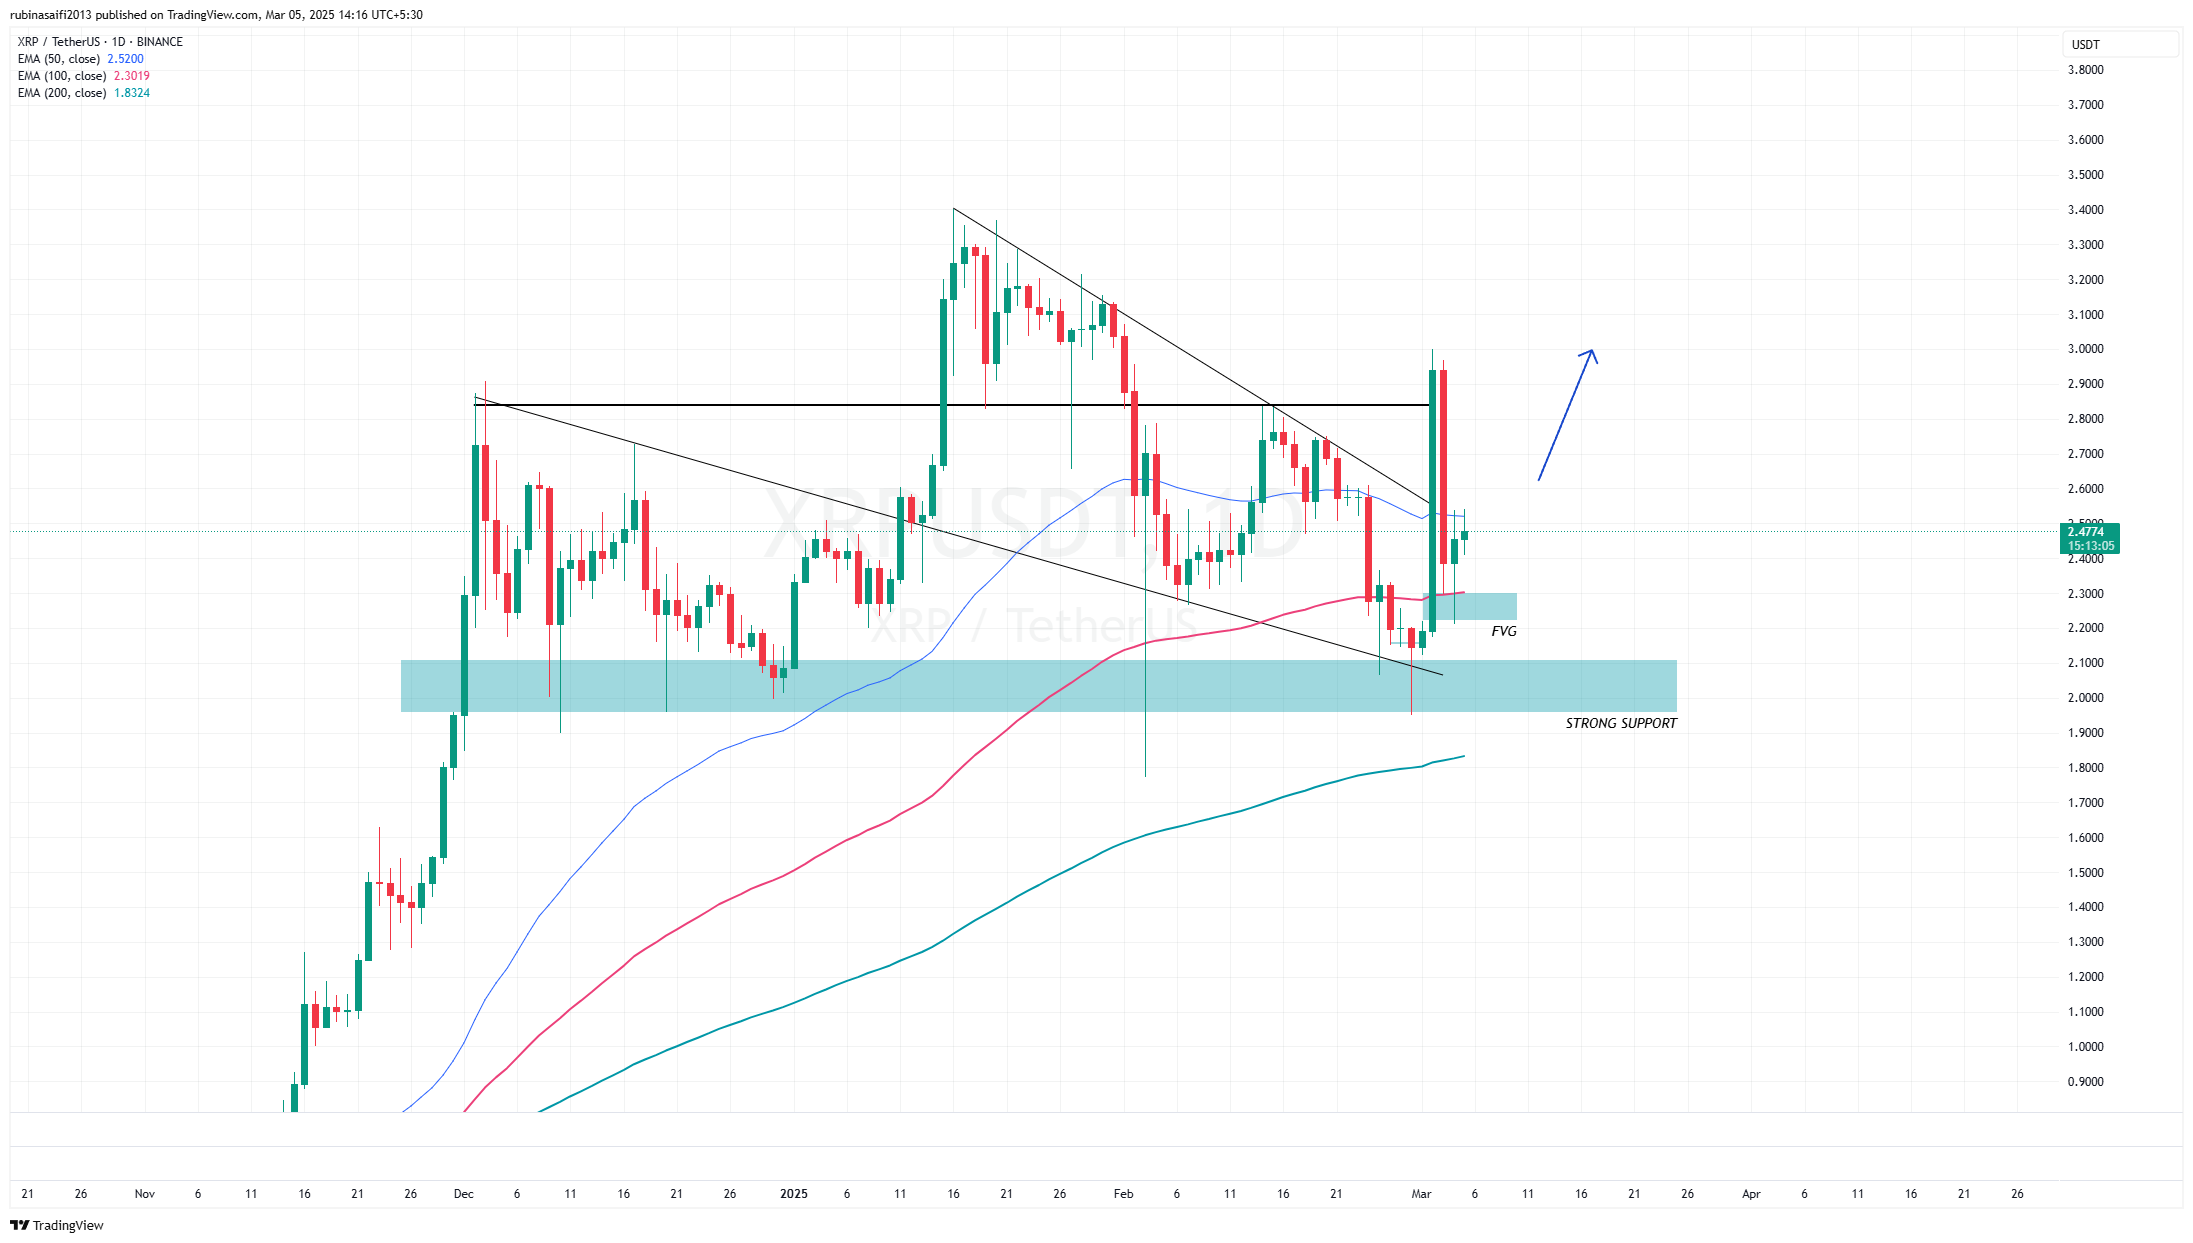
Ripple (XRP) has long been one of the most actively traded cryptocurrencies, attracting both short-term traders and long-term investors. In the attached chart, XRP is paired with USDT (Tether) on the daily timeframe. Several technical signals stand out, including a notable support zone, a Fair Value Gap (FVG) region, and moving average dynamics. Let’s break down each of these factors to see what they might mean for XRP’s price action in the near future.
1. Key Support Zone and FVG
- Strong Support Area (Blue Box)
- The chart highlights a prominent horizontal support region around the $0.36 – $0.38 range. This area has previously served as a pivot point for XRP, where price tends to bounce or consolidate.
- The label “STRONG SUPPORT” suggests that market participants see this zone as a high-demand area. Whenever price has approached or dipped below this zone, buyers have stepped in, pushing the price back up.
- Fair Value Gap (FVG)
- The same shaded box is also labeled as an “FVG,” a concept used by some traders to describe an imbalance in the market where price moves quickly without leaving much trading activity in between.
- Once the market re-enters such a zone, price often stalls or consolidates as orders get filled. This can lead to either a strong bounce (if demand is high) or further decline (if supply overwhelms demand).
Interpretation
- XRP’s recent retest of this $0.36 – $0.38 area and subsequent bounce suggest buyers are defending this zone. If the market holds above it, it can serve as a foundation for a sustained bullish push.
2. Trend Line Break and Price Action
- Downward Trend Line
- The chart shows a descending trend line (drawn from previous swing highs). Recently, XRP appears to have broken above this trend line.
- A break above a downtrend line often indicates a shift in momentum—from bearish or neutral to potentially bullish.
- Retest of the Trend Line
- After the breakout, price tends to retest the broken trend line to confirm it as support. If XRP maintains a daily close above that line and does not fall back under, it further solidifies a bullish bias.
- Bullish Candlestick
- Following the retest, there is a notable bullish candlestick that pushed price higher, reinforcing the idea that buyers are stepping in.
Interpretation
- Trend line breaks can be powerful signals for trend reversals or accelerations. If buyers defend this breakout zone, the bullish momentum may continue. However, a false breakout (where price falls back below the trend line) would invalidate this setup and could lead to renewed bearish pressure.
3. Moving Averages (MAs)
- Short-, Mid-, and Long-Term MAs
- In the chart, you can see three colored lines, often representing different moving averages:
- Red MA: This could be a shorter-term (e.g., 20- or 50-day) moving average.
- Blue MA: Possibly a mid-term (e.g., 50- or 100-day) moving average.
- Green MA: Typically the longer-term (e.g., 200-day) moving average.
- In the chart, you can see three colored lines, often representing different moving averages:
- Current Position of Price vs. MAs
- When price is above these MAs, especially the longer-term one, it suggests overall bullish sentiment. If XRP has just reclaimed or is trading above the 50-day and/or 200-day MA, that’s often viewed as a positive sign.
- Potential Crossover Signals
- If the shorter-term MA crosses above a longer-term MA (a “golden cross”), traders often interpret this as a bullish signal. Conversely, if the shorter-term MA crosses below the longer-term MA (a “death cross”), it can indicate bearish sentiment.
Interpretation
- Monitoring whether XRP can hold above these moving averages is key. Sustained trading above the 200-day MA, in particular, often aligns with a broader uptrend.
4. Potential Upside Targets and Resistance Levels
- Immediate Resistance
- After bouncing from $0.36–$0.38, the next short-term resistance may lie around recent swing highs (for instance, $0.42 – $0.44).
- Price may also face psychological resistance at round numbers like $0.50.
- Higher-Timeframe Resistance
- If XRP manages a strong close above $0.44–$0.45, it could target the previous major high near $0.50 or even higher.
- Volume profiles and historical price action suggest that once XRP clears mid-$0.40s, it may quickly travel toward $0.50+ if overall market conditions remain supportive.
- Bullish Scenario
- A decisive break above the near-term resistance, supported by rising volume, might open the door for a run toward $0.50 or beyond.
- Positive developments in broader crypto sentiment, along with fundamental factors like Ripple’s ongoing regulatory clarity, could further fuel a rally.
- Bearish Scenario
- If XRP fails to hold above the downtrend line or closes below the support zone ($0.36–$0.38) again, it could retest the lower levels.
- A drop below $0.36 might bring $0.32–$0.34 into focus as the next potential support area, based on historical price pivots.
5. Risk Management and Final Thoughts
- Stop-Loss Placement
- Traders who are bullish might consider placing stop-loss orders just below the $0.36 region to limit downside risk in case of a deeper correction.
- Position Sizing
- Given the inherent volatility of cryptocurrency markets, using smaller position sizes and adjusting them based on individual risk tolerance is advisable.
- Market Sentiment
- Keep an eye on overall crypto market trends, as major moves in Bitcoin or shifts in risk sentiment often spill over to altcoins like XRP.
- Fundamental news—especially around regulatory developments for Ripple—can have a dramatic impact on price action.
- Conclusion
- XRP’s bounce off a strong support zone and break of a downtrend line signal potential bullish momentum ahead. Holding above the moving averages adds to the optimism. However, to maintain a constructive outlook, XRP needs to stay above the broken trend line and the $0.36–$0.38 support region.
- Watch for sustained closes above near-term resistance to confirm further upside.
Summary
- Support/FVG Zone ($0.36–$0.38): Key demand area where buyers have shown strength.
- Downtrend Line Break: Suggests a momentum shift; retest of this line as support is crucial.
- Moving Averages: Price trading above key MAs indicates a potential uptrend; watch for any crossovers.
- Upside Targets: $0.42–$0.44 initially, then $0.50 or higher if bullish momentum persists.
- Risk Management: Consider stops below $0.36, mindful of broader market volatility.
In summary, the technicals point toward a possible bullish continuation for XRP if the strong support region holds and price maintains momentum above key moving averages. As always, remain vigilant for signs of weakening momentum or negative fundamental news that could invalidate the bullish bias.
Disclaimer: This article is for educational and informational purposes only. Cryptocurrency markets carry high risk, and you should do your own research or consult a professional before making any trading decisions.